Tilal Al Ghaf property prices, rental yields and capital growth
Published figures for Tilal Al Ghaf, each with its source and date, and the major projects nearby.
- Price per sq ft
- AED 2,278 per sq ft
- Gross yield
- 5.19%
- Change, 12 months
- +5.1%
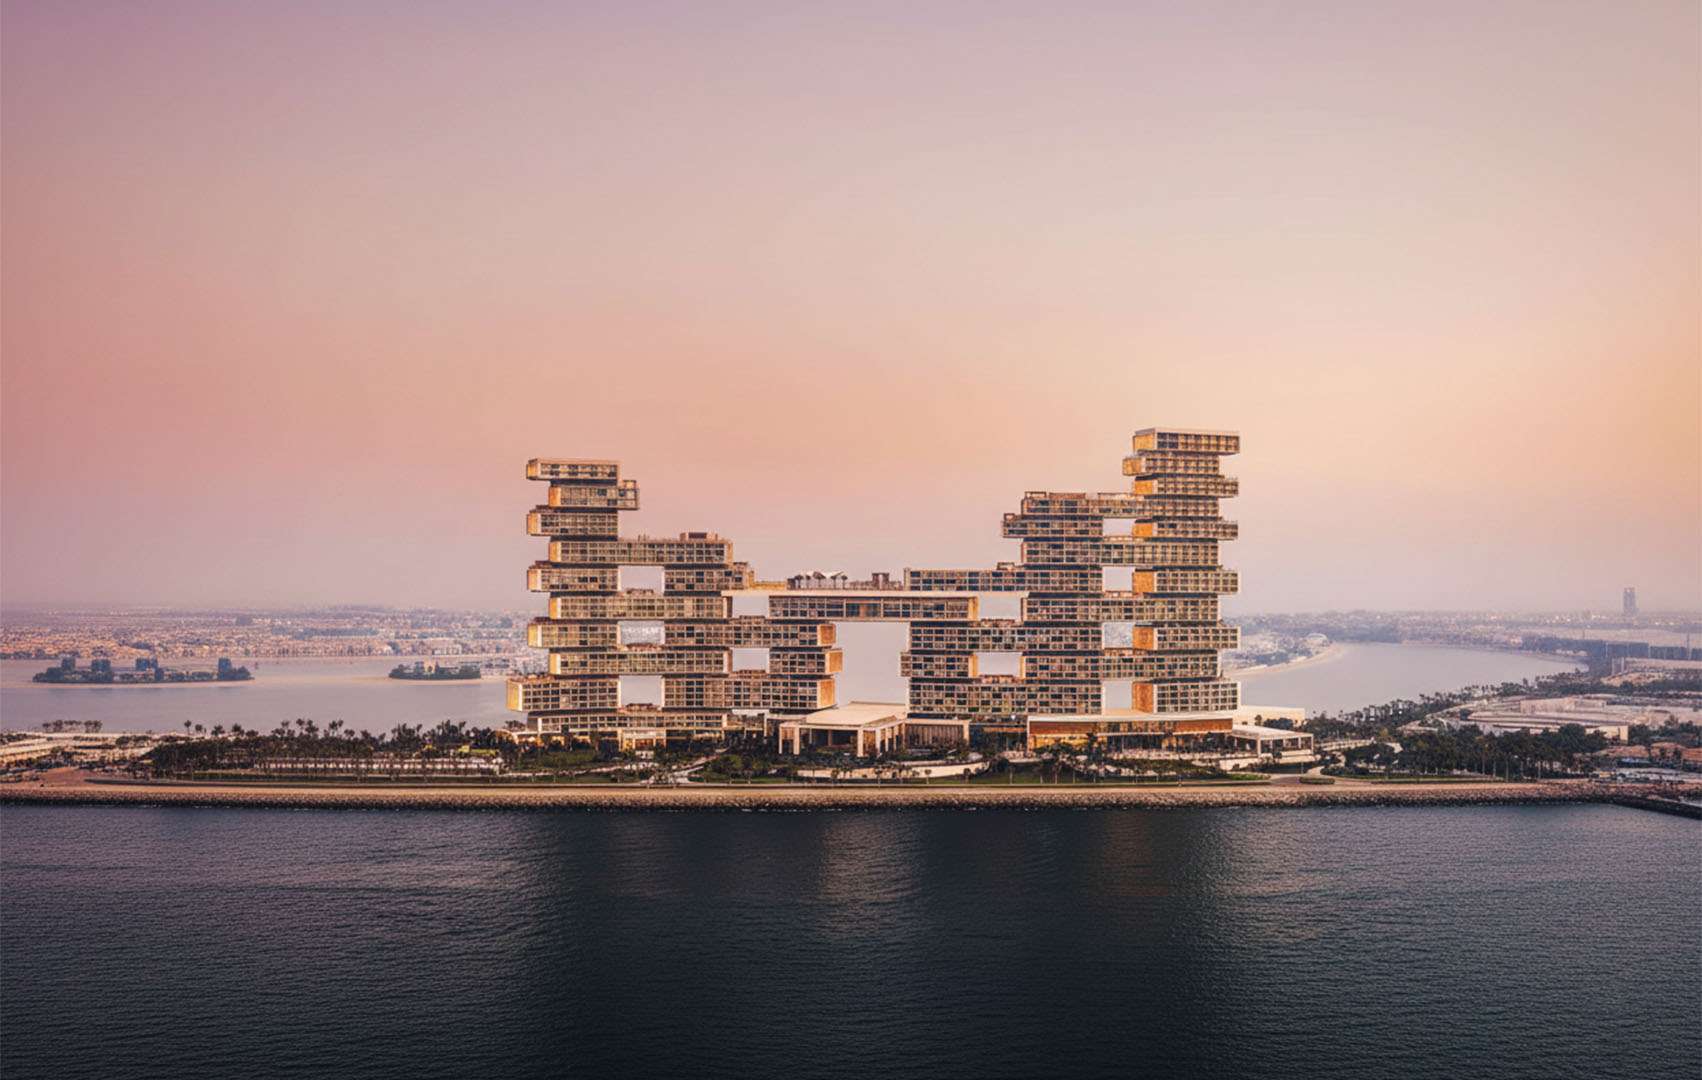
Illustrative image
Capital growth in Tilal Al Ghaf
Average sale price per sq ft and average sale price over four periods, each against the period of equal length before.
| Period | Price per sq ft | Change | Average price | Change | Sales | Change |
|---|---|---|---|---|---|---|
| 3 months3 months to 12 November 2026 | AED 2,265 per sq ft | +7.7% | AED 13,589,332 | +35.6% | 83 sales | +9.2% |
| 6 months6 months to 12 November 2026 | AED 2,188 per sq ft | -6.9% | AED 11,884,079 | +21.9% | 159 sales | -19.7% |
| 12 months12 months to 12 November 2026 | AED 2,278 per sq ft | +5.1% | AED 10,700,485 | -3.5% | 357 sales | -28% |
| 3 years3 years to 12 November 2026 | AED 2,096 per sq ft | +78.5% | AED 10,584,031 | +102.7%Mix shift | 1,517 sales | -50.6% |
Source: Property Finder, from Dubai Land Department records. Registered sales. Read 12 November 2026
Each change compares the average of everything registered in one period with the period before. It moves with the mix of homes sold as well as with prices, so it is not like-for-like growth.
Read with care: this change is 100% or more. That usually means a different mix of homes was registered in this period, such as the first sales in a new project or larger homes, not that like-for-like prices moved this much.
Rents in Tilal Al Ghaf
Average annual rent on registered tenancy contracts, new contracts and renewals reported separately.
| Period | New contracts | Change | Renewals | Change | Contracts | Change |
|---|---|---|---|---|---|---|
| 12 months12 months to 12 November 2026 | AED 322,515 a year | -27.4% | AED 285,991 a year | +24.2% | 1,350 contracts | +22.7% |
| 3 years3 years to 12 November 2026 | AED 348,183 a year | +90% | AED 251,295 a year | No comparison published | 3,055 contracts | +856.3%Mix shift |
Source: Property Finder, from Dubai Land Department records. Registered tenancy contracts. Read 12 November 2026
Price per sq ft and rental yield
The headline figures we quote across the site.
- Price per sq ft
- AED 2,278 per sq ftSource: Property Finder, from Dubai Land Department records12 months to 12 November 2026. Registered sales. Read 12 November 2026
- Gross rental yield
- 5.19%Source: Property Finder, from Dubai Land Department records12 months to 12 November 2026. Property Finder calculation from registered sales and rents. Read 12 November 2026
- Average annual rent, new contracts
- AED 322,515 a yearSource: Property Finder, from Dubai Land Department records12 months to 12 November 2026. Registered tenancy contracts. Read 12 November 2026
On the map
The marker is the area's map point. Centre of the area as mapped by OpenStreetMap.
Map point: OpenStreetMap contributors (ODbL)
Questions about Tilal Al Ghaf prices
What is the average price per sq ft in Tilal Al Ghaf?
AED 2,278 per sq ft, the average sale price per sq ft for 12 months to 12 November 2026 (Registered sales). Source: Property Finder, from Dubai Land Department records.
What rental yield can you get in Tilal Al Ghaf?
The published average gross rental yield is 5.19% (All residential, 12 months to 12 November 2026). Source: Property Finder, from Dubai Land Department records. Gross yield is before service charges and other costs.
How much is rent in Tilal Al Ghaf?
The average annual rent on new tenancy contracts was AED 322,515 a year over 12 months to 12 November 2026. Source: Property Finder, from Dubai Land Department records.
Are property prices in Tilal Al Ghaf rising or falling?
The average price per sq ft changed by +7.7% over 3 months, -6.9% over 6 months, +5.1% over 12 months and +78.5% over 3 years, each against the period of equal length before. Source: Property Finder, from Dubai Land Department records.
How the atlas is built
- Every figure is copied as published by a named source, with its link, the period it covers and the date we read it. Nothing is estimated, interpolated, averaged or rounded.
- Dubai price, rent and change figures come from Property Finder's transaction pages, which publish averages of Dubai Land Department registered sales and tenancy contracts for the last 3 months, 6 months, 12 months and 3 years, with a change against the period before.
- Abu Dhabi, Sharjah and Ras Al Khaimah figures come from Bayut's asking-price index: advertised prices, not completed sales, which usually sit above transaction prices.
- ValuStrat readings are valuation-based and appear only where the press reported a community by name.
- Sources measure different things. Compare areas within one source and one period, never across sources.
- Projects and regeneration zones come from official releases where we could read them, otherwise from The National, Khaleej Times or Gulf News. A project is listed against an area when a source places it there, or when its mapped point is within 5 km of the area's point.
- Price effects of projects are published claims, attributed to the publisher. The atlas never says that a project caused a price change.
Data compiled 12 November 2026.
Talk the numbers through with an adviser
We will tell you what these figures mean for the homes you are looking at in Tilal Al Ghaf, and what is being built nearby. No fee to the buyer on off-plan.
- Current price list and availability, direct from the developer
- No fee to you on off-plan purchases: the developer pays us
- One salaried adviser, not on commission, from first call to handover