
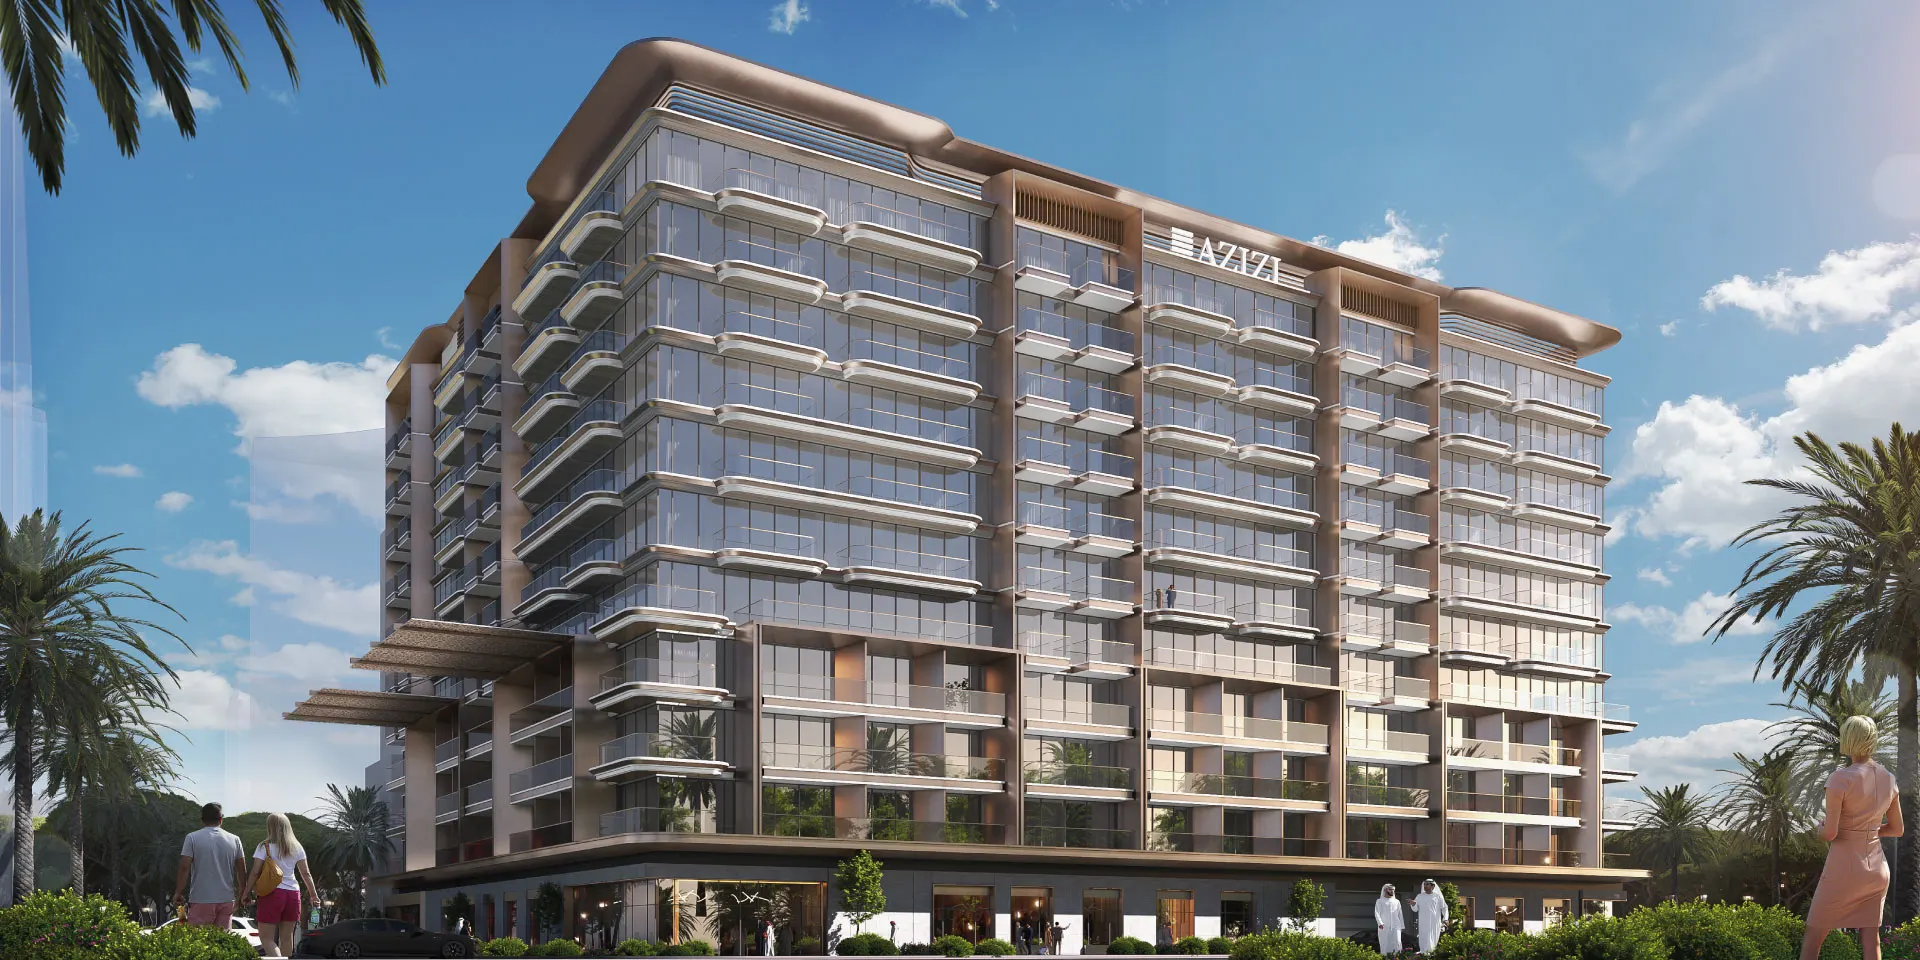
Off-plan
Azizi Wares
Azizi Developments
- Apartments
- Studio to 3 bed
- 330 to 1,015 sq ft
- Handover Q1 2028
- 10/40/50 plan
From AED 619K
Downtown Jebel Ali, Dubai
Published figures for Downtown Jebel Ali, each with its source and date, and the major projects nearby.
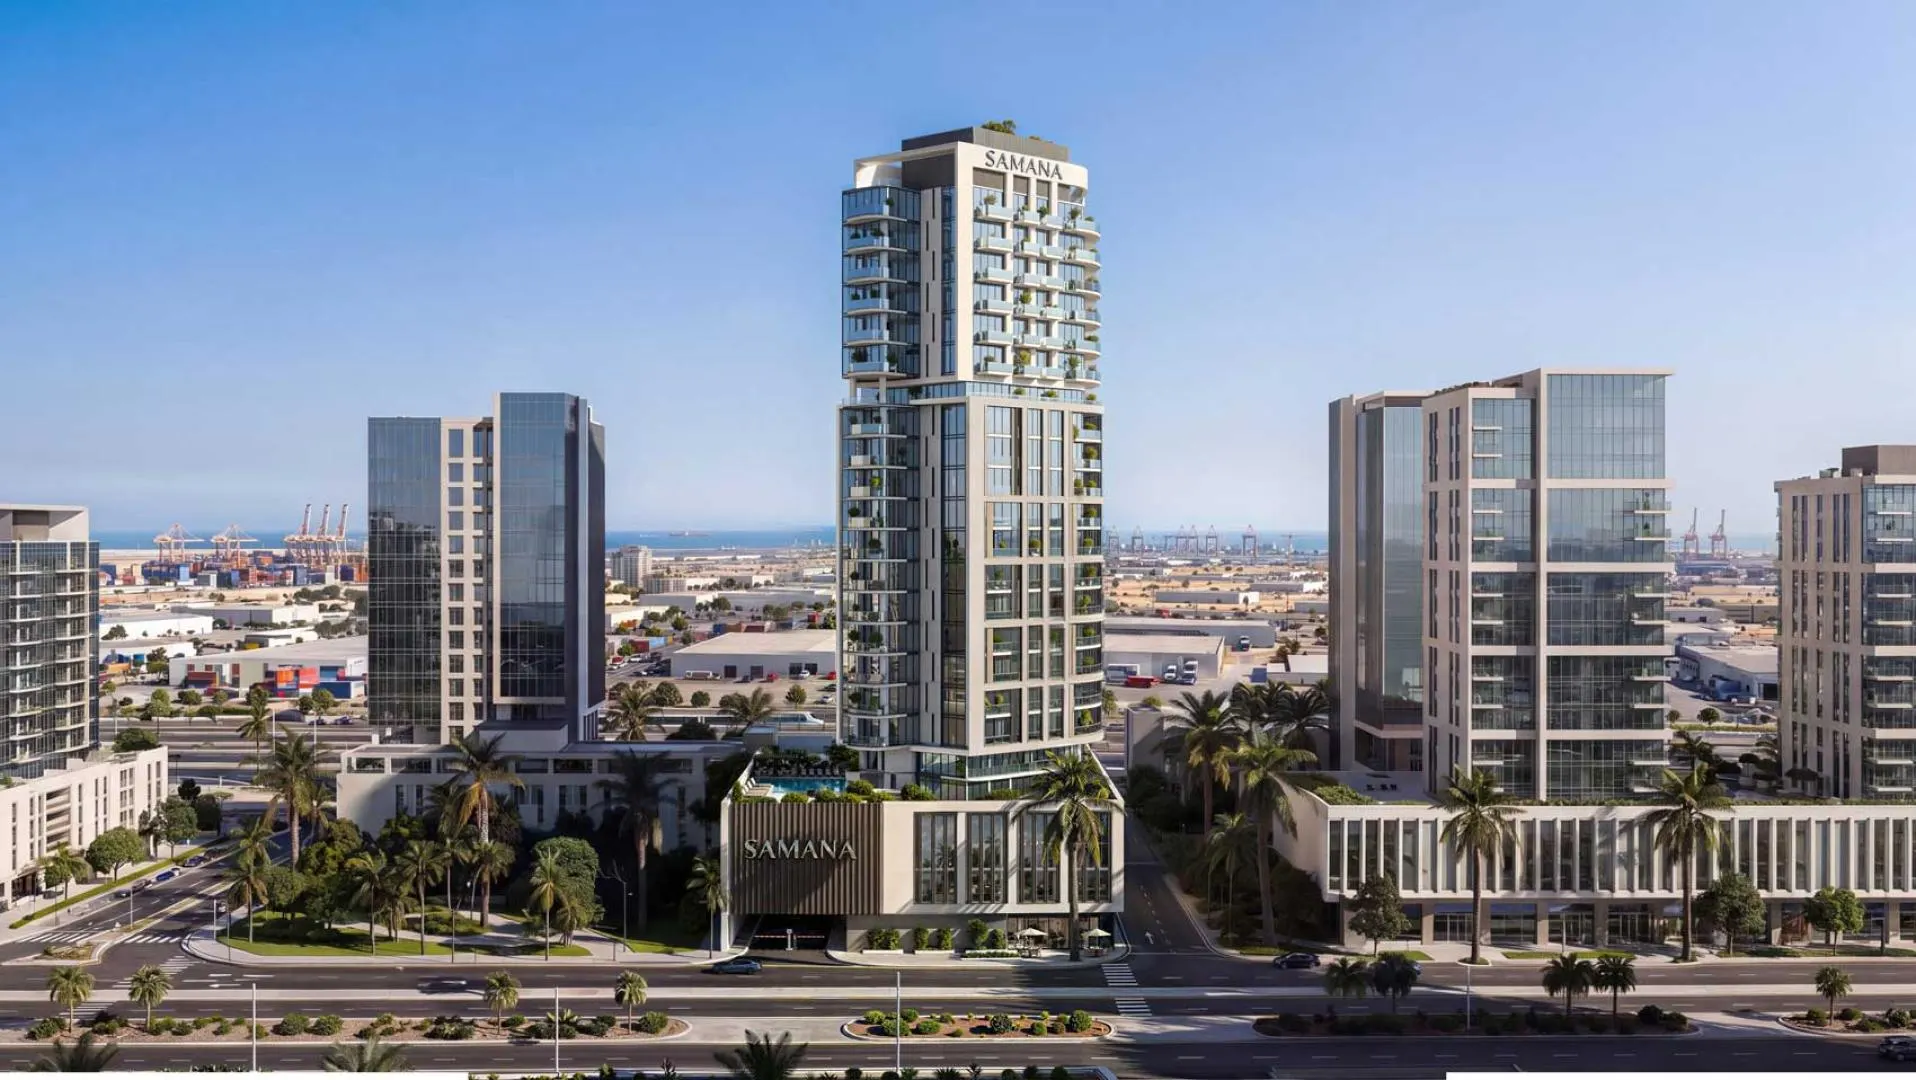
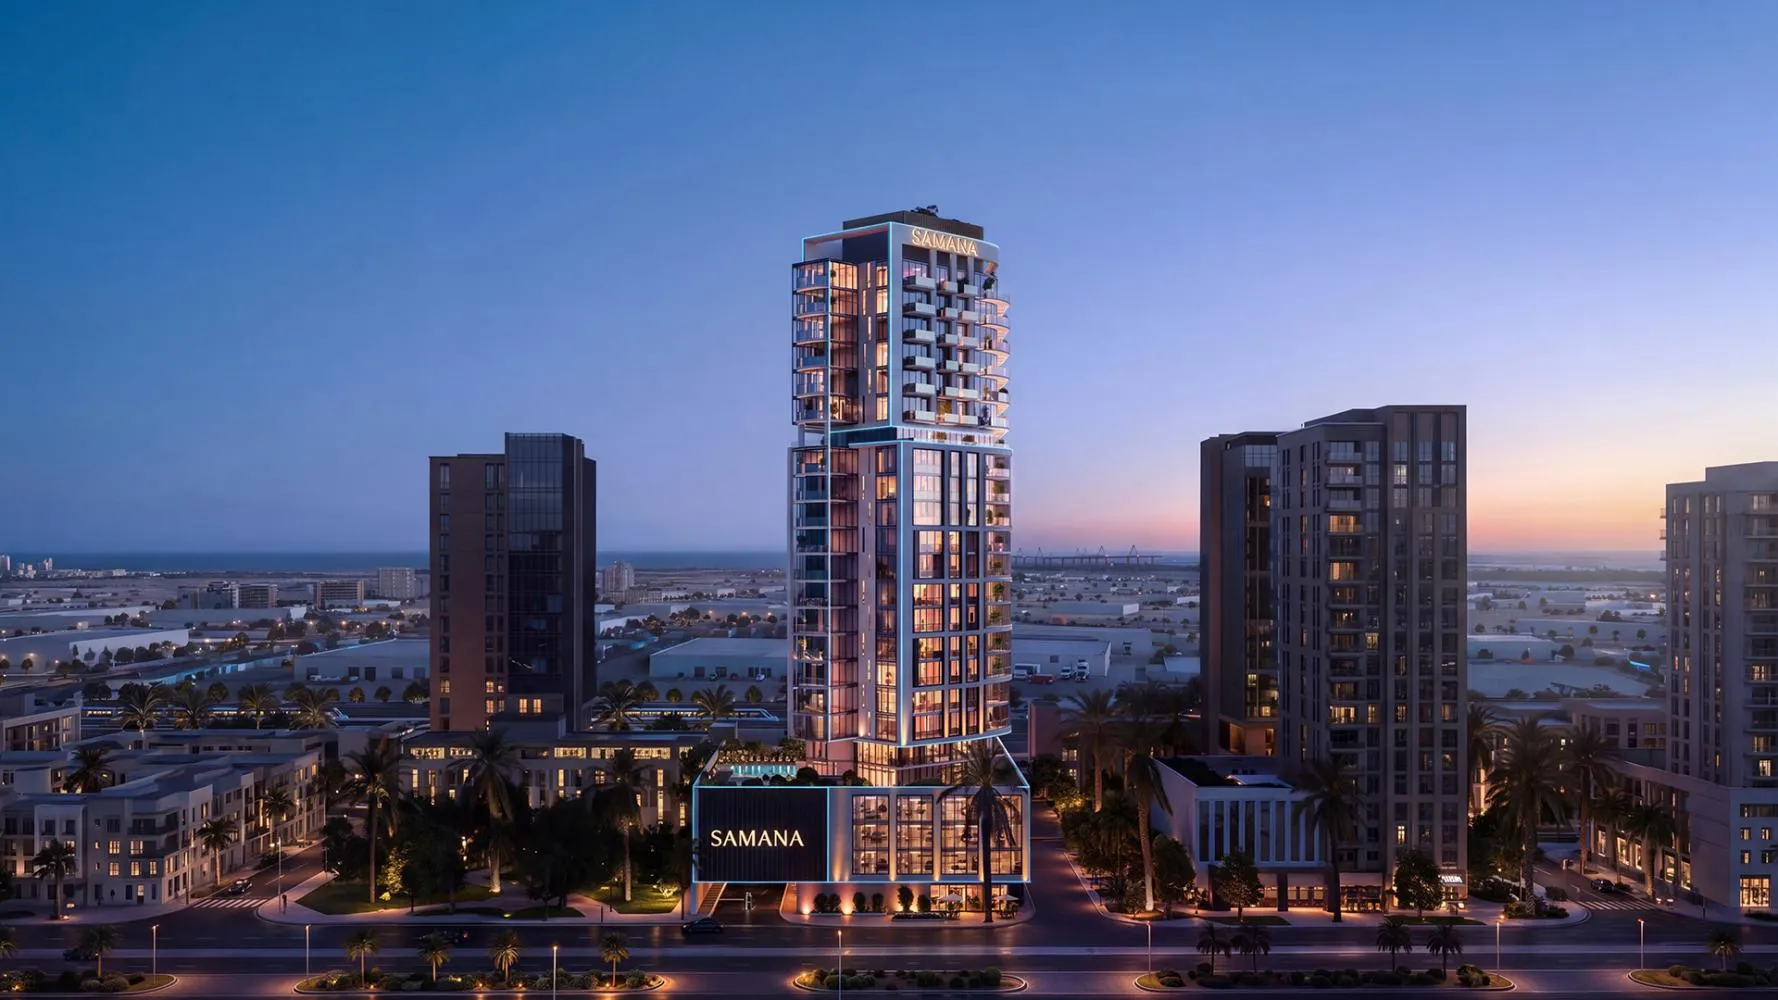
Pictured: Samana Downtown One by Samana Developers
Average sale price per sq ft and average sale price over four periods, each against the period of equal length before.
| Period | Price per sq ft | Change | Average price | Change | Sales | Change |
|---|---|---|---|---|---|---|
| 3 months3 months to 12 November 2026 | AED 1,650 per sq ft | +1.1% | AED 877,526 | +5.6% | 1,087 sales | -36.1% |
| 6 months6 months to 12 November 2026 | AED 1,639 per sq ft | +17.3% | AED 849,936 | -58.1% | 2,762 sales | +1,409.3%Mix shift |
| 12 months12 months to 12 November 2026 | AED 1,624 per sq ft | +30.7% | AED 924,289 | -7.8% | 2,931 sales | +973.6%Mix shift |
| 3 years3 years to 12 November 2026 | AED 1,561 per sq ft | +50.3% | AED 931,651 | +45.1% | 3,372 sales | +647.7%Mix shift |
Source: Property Finder, from Dubai Land Department records. Registered sales. Read 12 November 2026
Each change compares the average of everything registered in one period with the period before. It moves with the mix of homes sold as well as with prices, so it is not like-for-like growth.
Read with care: this change is 100% or more. That usually means a different mix of homes was registered in this period, such as the first sales in a new project or larger homes, not that like-for-like prices moved this much.
Average annual rent on registered tenancy contracts, new contracts and renewals reported separately.
| Period | New contracts | Change | Renewals | Change | Contracts | Change |
|---|---|---|---|---|---|---|
| 12 months12 months to 12 November 2026 | AED 57,873 a year | -93.7% | AED 53,391 a year | +1.4% | 967 contracts | +7.1% |
| 3 years3 years to 12 November 2026 | AED 396,223 a year | +942%Mix shift | AED 50,689 a year | +39.9% | 2,478 contracts | +50.7% |
Source: Property Finder, from Dubai Land Department records. Registered tenancy contracts. Read 12 November 2026
The headline figures we quote across the site.
The marker is the area's map point. Centre of the area as mapped by OpenStreetMap.
Map point: OpenStreetMap contributors (ODbL)
Off-plan
Azizi Developments
From AED 619K
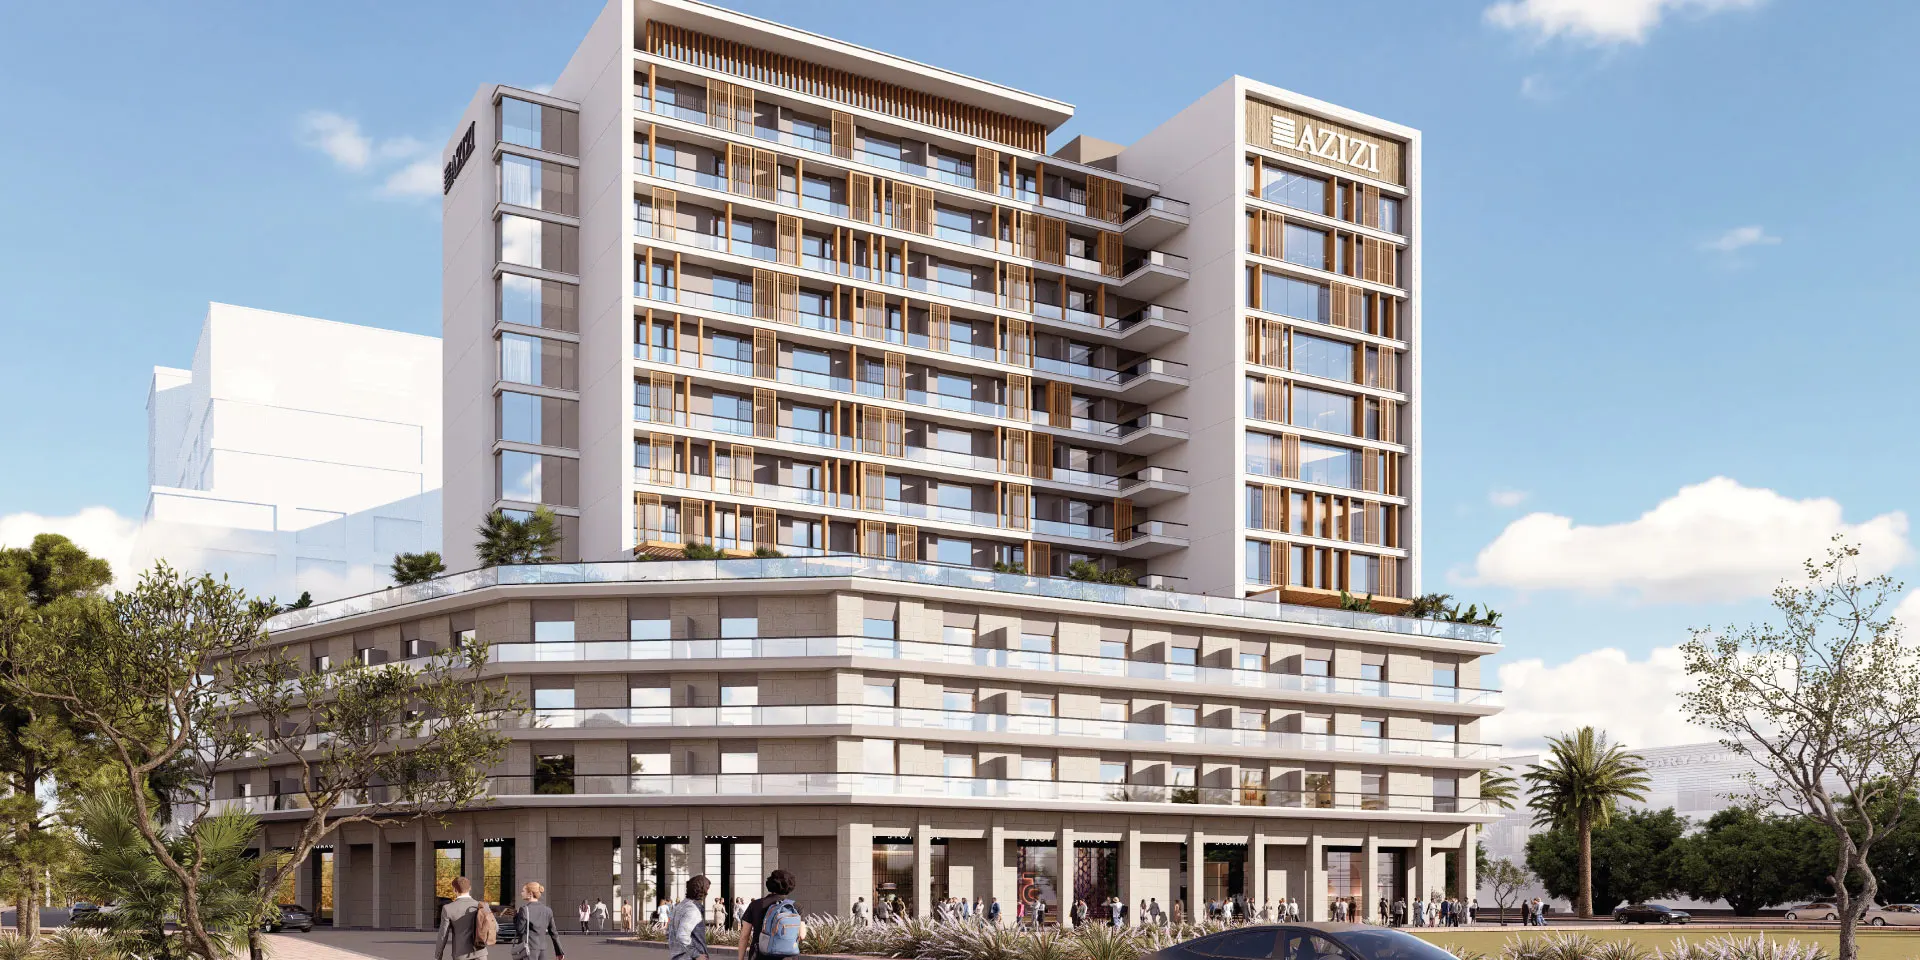
Off-plan
Azizi Developments
From AED 572K
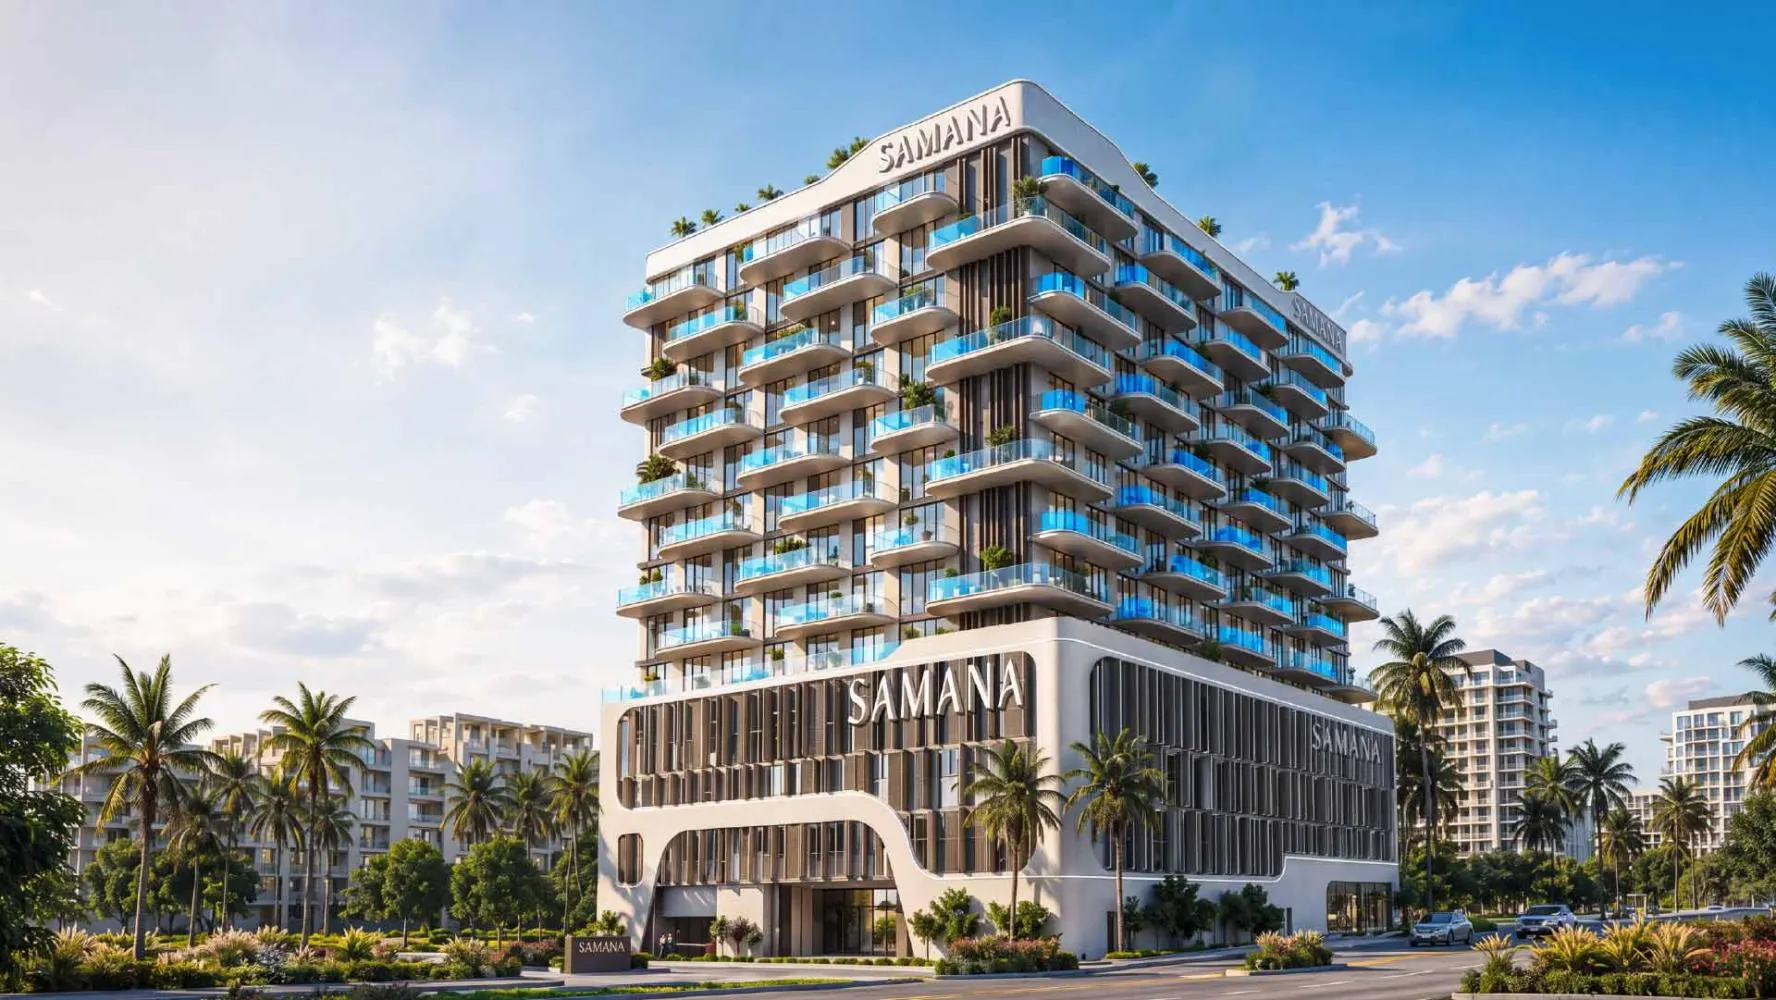
Off-plan
Samana Developers
From AED 1.1M
Off-plan
Samana Developers
From AED 689K
AED 1,624 per sq ft, the average sale price per sq ft for 12 months to 12 November 2026 (Registered sales). Source: Property Finder, from Dubai Land Department records.
The published average gross rental yield is 9.24% (All residential, 12 months to 12 November 2026). Source: Property Finder, from Dubai Land Department records. Gross yield is before service charges and other costs.
The average annual rent on new tenancy contracts was AED 57,873 a year over 12 months to 12 November 2026. Source: Property Finder, from Dubai Land Department records.
The average price per sq ft changed by +1.1% over 3 months, +17.3% over 6 months, +30.7% over 12 months and +50.3% over 3 years, each against the period of equal length before. Source: Property Finder, from Dubai Land Department records.
Data compiled 12 November 2026.
We will tell you what these figures mean for the homes you are looking at in Downtown Jebel Ali, and what is being built nearby. No fee to the buyer on off-plan.
The full picture, without the pressure
Browse developments