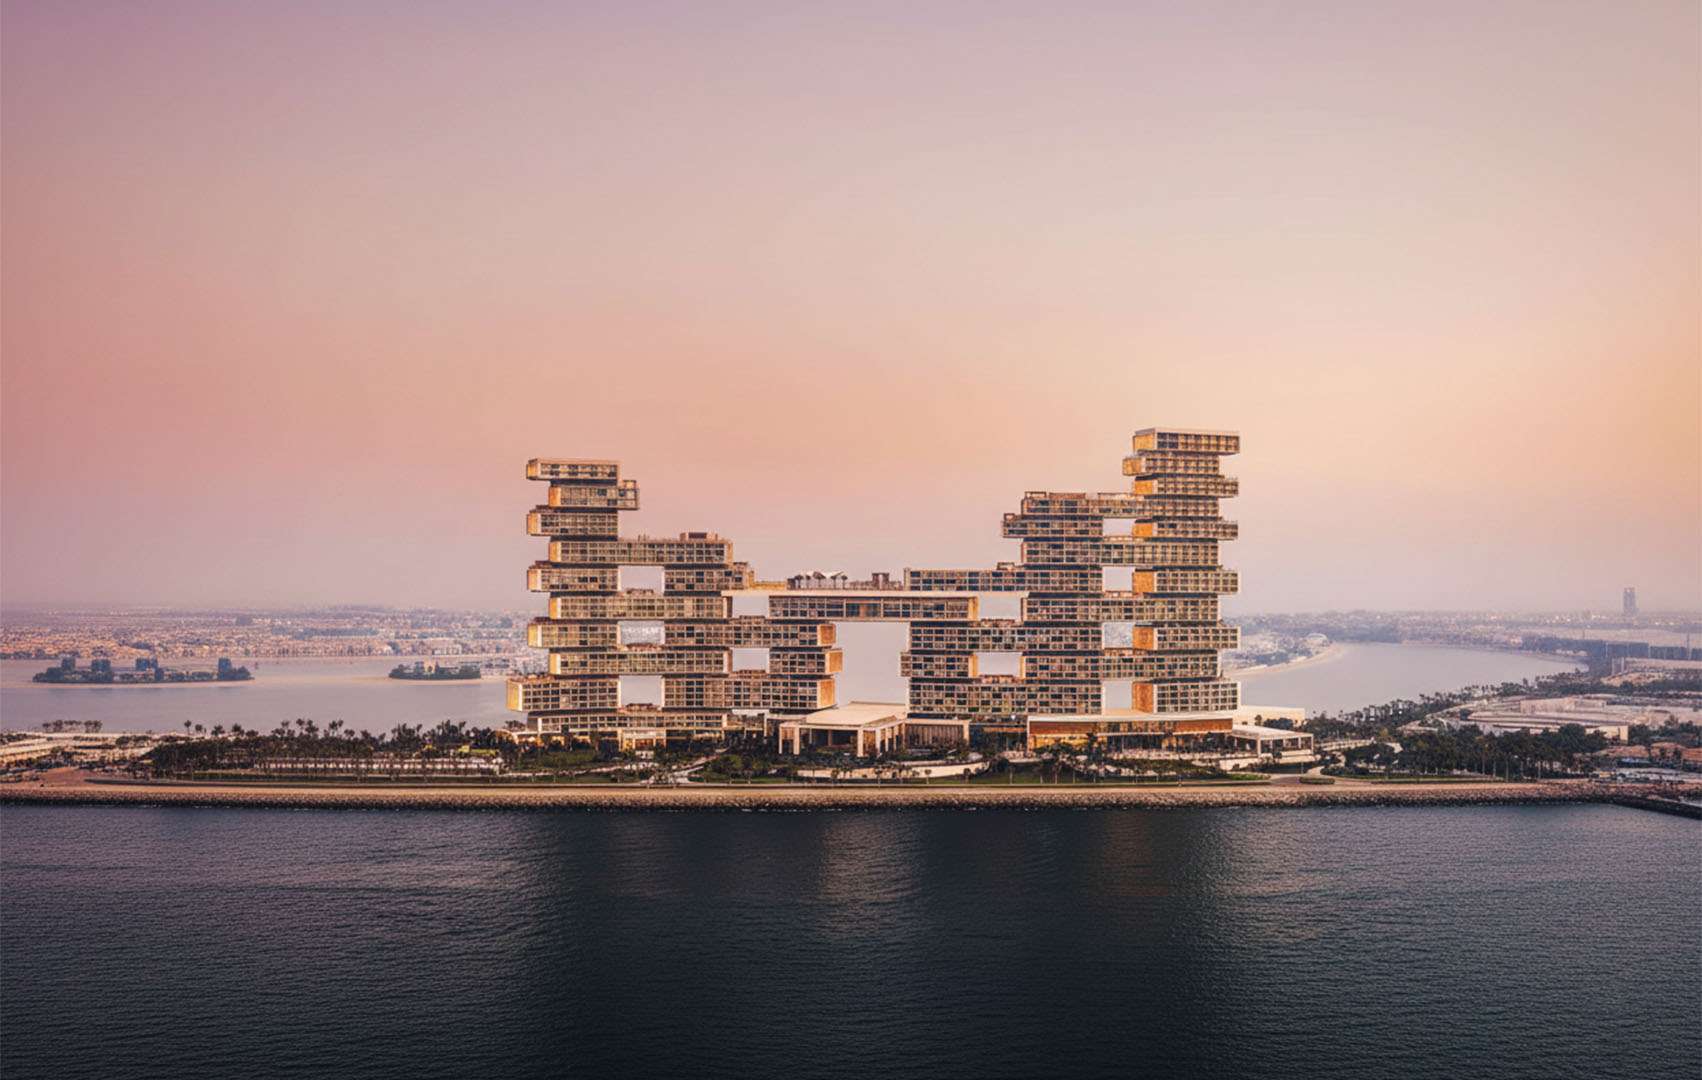
Developer rendering of the Vision Iconic at Binghatti City exterior

Nad Al Sheba property prices, rental yields and capital growth

Published figures for Nad Al Sheba, each with its source and date, and the major projects nearby.

Price per sq ft
AED 3,133 per sq ft
Gross yield
4.61%
Change, 12 months
+48.1%

Pictured: Vision Iconic by Binghatti

Capital growth in Nad Al Sheba

Average sale price per sq ft and average sale price over four periods, each against the period of equal length before.

Registered sales in Nad Al Sheba by period
PeriodPrice per sq ftChangeAverage priceChangeSalesChange
3 months3 months to 12 November 2026AED 3,134 per sq ft+0.3%AED 3,029,357+4.3%325 sales-33%
6 months6 months to 12 November 2026AED 3,125 per sq ft-0.4%AED 2,951,838-26.7%795 sales-53.7%
12 months12 months to 12 November 2026AED 3,133 per sq ft+48.1%AED 3,687,105-57.6%2,513 sales+152.8%Mix shift
3 years3 years to 12 November 2026AED 2,708 per sq ft+176.4%Mix shiftAED 5,663,362+18.5%4,111 sales+310.7%Mix shift

Source: Property Finder, from Dubai Land Department records. Registered sales. Read 12 November 2026

Each change compares the average of everything registered in one period with the period before. It moves with the mix of homes sold as well as with prices, so it is not like-for-like growth.

Read with care: this change is 100% or more. That usually means a different mix of homes was registered in this period, such as the first sales in a new project or larger homes, not that like-for-like prices moved this much.

Rents in Nad Al Sheba

Average annual rent on registered tenancy contracts, new contracts and renewals reported separately.

Registered tenancy contracts in Nad Al Sheba by period
PeriodNew contractsChangeRenewalsChangeContractsChange
12 months12 months to 12 November 2026AED 239,272 a year-15.2%AED 223,529 a year+15.6%1,587 contracts+27.8%
3 years3 years to 12 November 2026AED 258,559 a year+44.5%AED 199,209 a year+42.7%3,721 contracts+31.5%

Source: Property Finder, from Dubai Land Department records. Registered tenancy contracts. Read 12 November 2026

Price per sq ft and rental yield

The headline figures we quote across the site.

Price per sq ft
AED 3,133 per sq ftSource: Property Finder, from Dubai Land Department records12 months to 12 November 2026. Registered sales. Read 12 November 2026
Gross rental yield
4.61%Source: Property Finder, from Dubai Land Department records12 months to 12 November 2026. Property Finder calculation from registered sales and rents. Read 12 November 2026
Average annual rent, new contracts
AED 239,272 a yearSource: Property Finder, from Dubai Land Department records12 months to 12 November 2026. Registered tenancy contracts. Read 12 November 2026

On the map

The marker is the area's map point. Approximate point from our area guide.

Map point: approximate, from our area guide

Map data © OpenStreetMap contributors (ODbL). Tiles Esri

Major projects near Nad Al Sheba

Projects a source places in or beside Nad Al Sheba, or within 5 km of its map point.

Transport

Dubai Metro Gold Line

Announced (April 2026); RTA said in September 2026 the tender is scheduled for issue by the end of 2026

Named among areas on the Gold Line route map.

Project page

Reported effect on property prices

Published claims, quoted with who made them and when. They are not our findings, and some come from parties with an interest, such as developers, brokers or the transport authority.

Khaleej Times reported RTA Director General Mattar Al Tayer as saying land values around future Dubai Metro stations could rise by 15 to 30 per cent. This is a forward estimate covering future stations generally, with no study cited.
Khaleej Times, Forecast, published 14 September 2026. Read 12 November 2026

New developments for sale in Nad Al Sheba

All developments in Nad Al Sheba
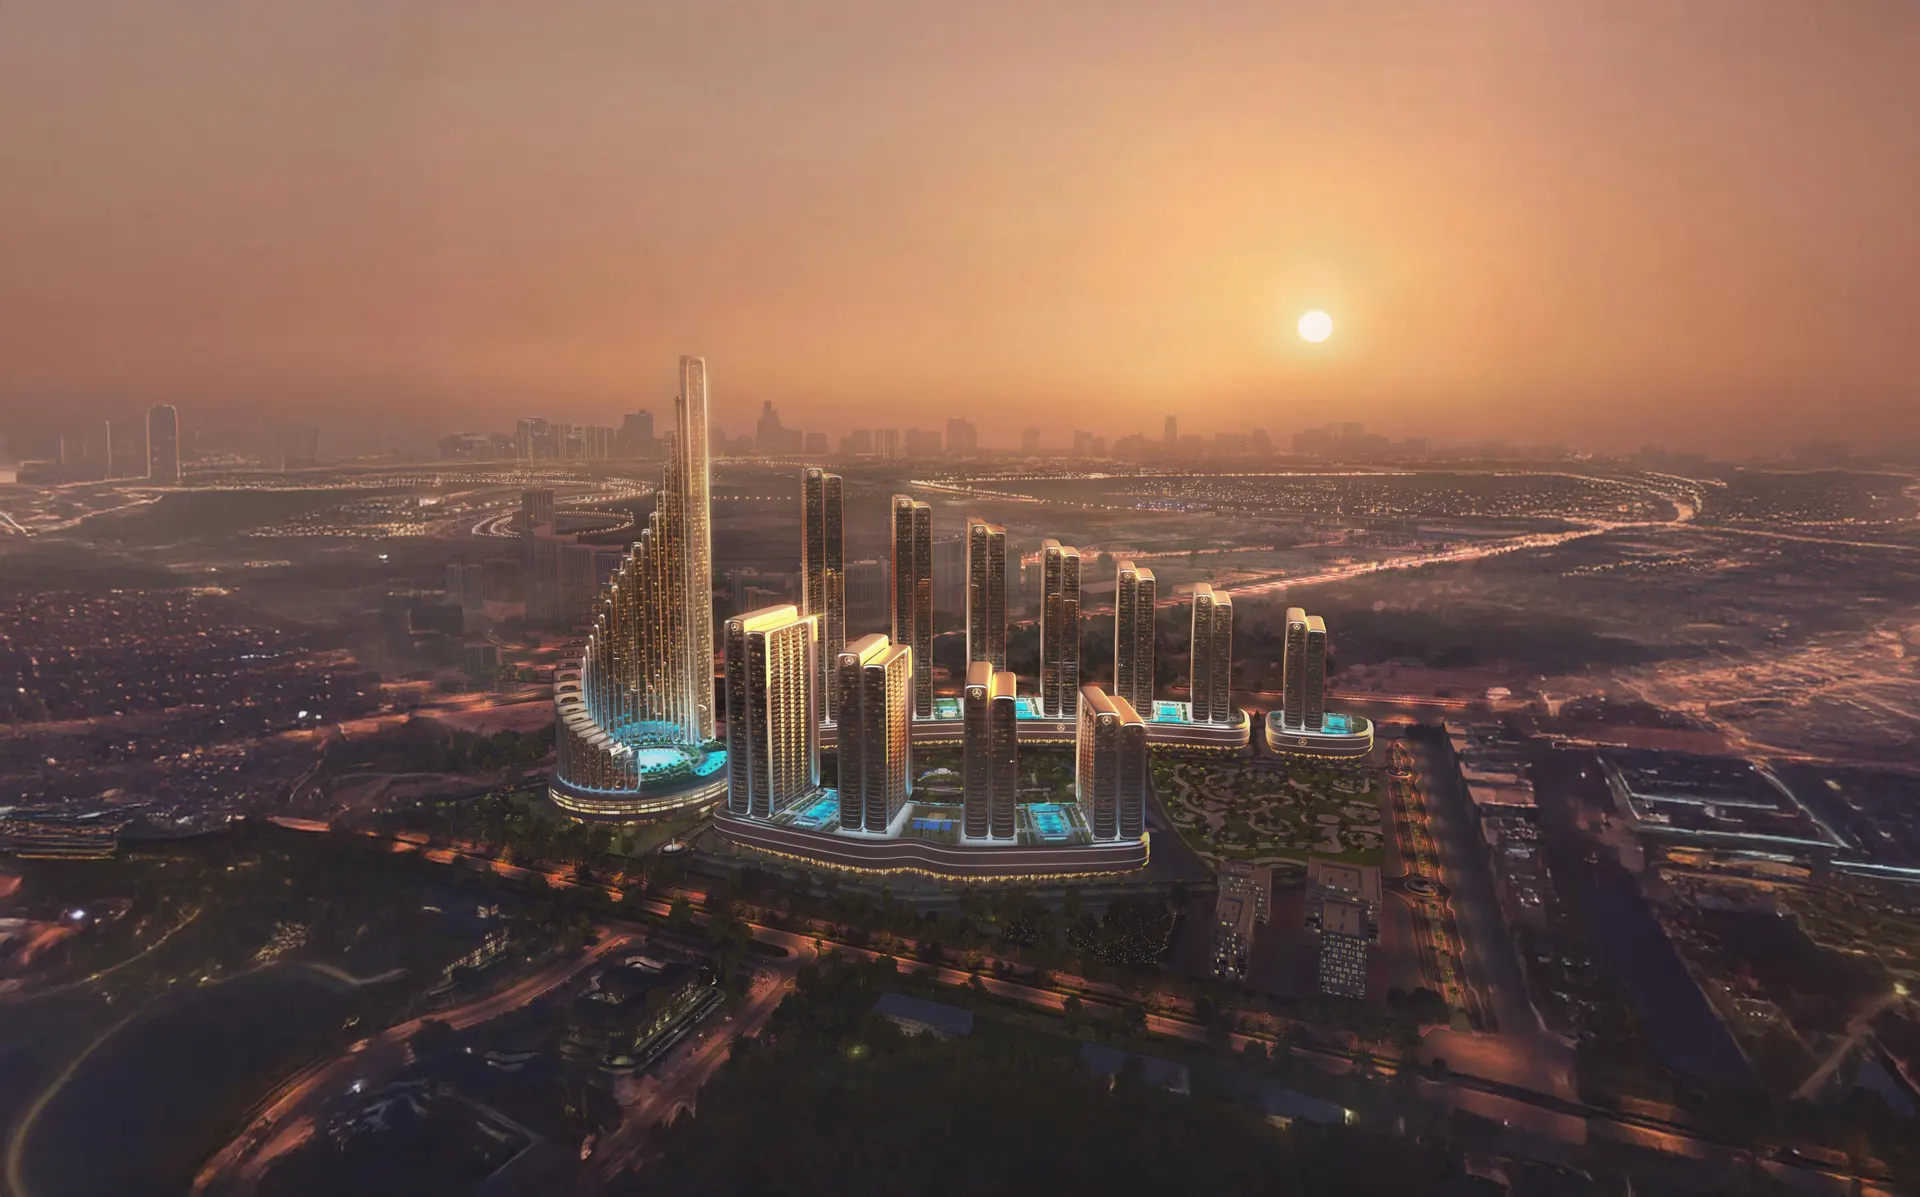
  • Developer rendering of the Vision Iconic at Binghatti City building exterior

    Off-plan

    Vision Iconic

    Binghatti

    • Apartments
    • 1 to 5 bed
    • 694 to 2,476 sq ft
    • Handover Q4 2028
    • Payment plan

    From AED 2.31M

    Nad Al Sheba, Dubai

Questions about Nad Al Sheba prices

What is the average price per sq ft in Nad Al Sheba?

AED 3,133 per sq ft, the average sale price per sq ft for 12 months to 12 November 2026 (Registered sales). Source: Property Finder, from Dubai Land Department records.

What rental yield can you get in Nad Al Sheba?

The published average gross rental yield is 4.61% (All residential, 12 months to 12 November 2026). Source: Property Finder, from Dubai Land Department records. Gross yield is before service charges and other costs.

How much is rent in Nad Al Sheba?

The average annual rent on new tenancy contracts was AED 239,272 a year over 12 months to 12 November 2026. Source: Property Finder, from Dubai Land Department records.

Are property prices in Nad Al Sheba rising or falling?

The average price per sq ft changed by +0.3% over 3 months, -0.4% over 6 months, +48.1% over 12 months and +176.4% over 3 years, each against the period of equal length before. The 3 years change is 100% or more, which usually reflects a different mix of homes sold rather than like-for-like prices. Source: Property Finder, from Dubai Land Department records.

What major projects are near Nad Al Sheba?

Dubai Metro Gold Line. Each project page gives its status, timeline and any reported effect on prices.

How the atlas is built

  • Every figure is copied as published by a named source, with its link, the period it covers and the date we read it. Nothing is estimated, interpolated, averaged or rounded.
  • Dubai price, rent and change figures come from Property Finder's transaction pages, which publish averages of Dubai Land Department registered sales and tenancy contracts for the last 3 months, 6 months, 12 months and 3 years, with a change against the period before.
  • Abu Dhabi, Sharjah and Ras Al Khaimah figures come from Bayut's asking-price index: advertised prices, not completed sales, which usually sit above transaction prices.
  • ValuStrat readings are valuation-based and appear only where the press reported a community by name.
  • Sources measure different things. Compare areas within one source and one period, never across sources.
  • Projects and regeneration zones come from official releases where we could read them, otherwise from The National, Khaleej Times or Gulf News. A project is listed against an area when a source places it there, or when its mapped point is within 5 km of the area's point.
  • Price effects of projects are published claims, attributed to the publisher. The atlas never says that a project caused a price change.

Data compiled 12 November 2026.

Talk the numbers through with an adviser

We will tell you what these figures mean for the homes you are looking at in Nad Al Sheba, and what is being built nearby. No fee to the buyer on off-plan.

  • Current price list and availability, direct from the developer
  • No fee to you on off-plan purchases: the developer pays us
  • One salaried adviser, not on commission, from first call to handover

Need more information?

+44 330 122 5848
WhatsApp usEmail
Add budget and details

We use your details only to answer this request. See our privacy policy.

Rather talk now?WhatsAppCall